Glossary
Emitters: Group of subwoofers primarily intended to reproduce sound. These subwoofers also contribute to absorbing residual sound that cannot be eliminated by the absorbers.
Absorbers: Group of subwoofers intended to absorb sound.
Waveforming Filters: Set of correction filters applied to each individual subwoofer.
Listening Zone: Volume within the room that encompasses the audience.
Reference Seating Position (RSP): Position used as reference to evaluate the acoustic performance metrics of the room. It is typically located at the center of the front row.
Calibration Zone: Volume of the room where acoustic field measurements are conducted during the WaveForming calibration phase. This zone should include the listening zone.
Wavelet Spectrogram: Spectrogram of the impulse response obtained through the gamma-tone transformation.
Waveguide: Structure that guides sound in a preferred direction.
Transverse Cross-section: Waveguide cross-section perpendicular to the propagation direction.
Transverse mode: Acoustic mode of the transverse cross-section.
Group Velocity: Speed at which a transverse mode propagates sound energy through the room as a function of frequency. The group velocity is measured in meters per second.
Mean Spatial Deviation (MSD): Metric to assess the uniformity of the acoustic responses across the optimization zone. It measures the spatial standard deviation of the room's frequency responses at the different calibration points, averaged over the 30-80 Hz frequency band. The MSD is measured in dB.
DT60: Metric to assess the decay time of a room. It measures the time required for the amplitude of the room impulse response to decay by 60 dB, expressed in 1/3-octave bands. The DT60 is measured in seconds.
Introduction
Everyone has experienced the tight, impactful, and detailed low-frequency sound in outdoor concerts or large concert halls, or the powerful sound of fireworks. This clear bass reproduction is due to the clean and natural propagation of sound from the emitter to the listener, with minimal interference from the environment.
Indoors, however, the story is quite different, as bass reproduction is heavily influenced by room modes. Much like how a guitar string amplifies specific musical notes, room modes amplify sound at certain frequencies. At these frequencies, the sound pressure distribution becomes highly uneven. Some areas have very weak bass, while others experience a strong amplification, sometimes reaching up to +20 dB (10 times the amplitude of the average level). Additionally, room resonance sustains the sound for extended periods. This standing sound mixes with new incoming sounds, creating a confusing listening experience where only the loudest tones dominate, blurring finer details.
WaveForming’s ultimate goal is to replicate the pristine bass experience of open spaces when reproducing sound indoors, generating a clean and compact wavefront that propagates through the room without being affected by boundary reflections or room modes.
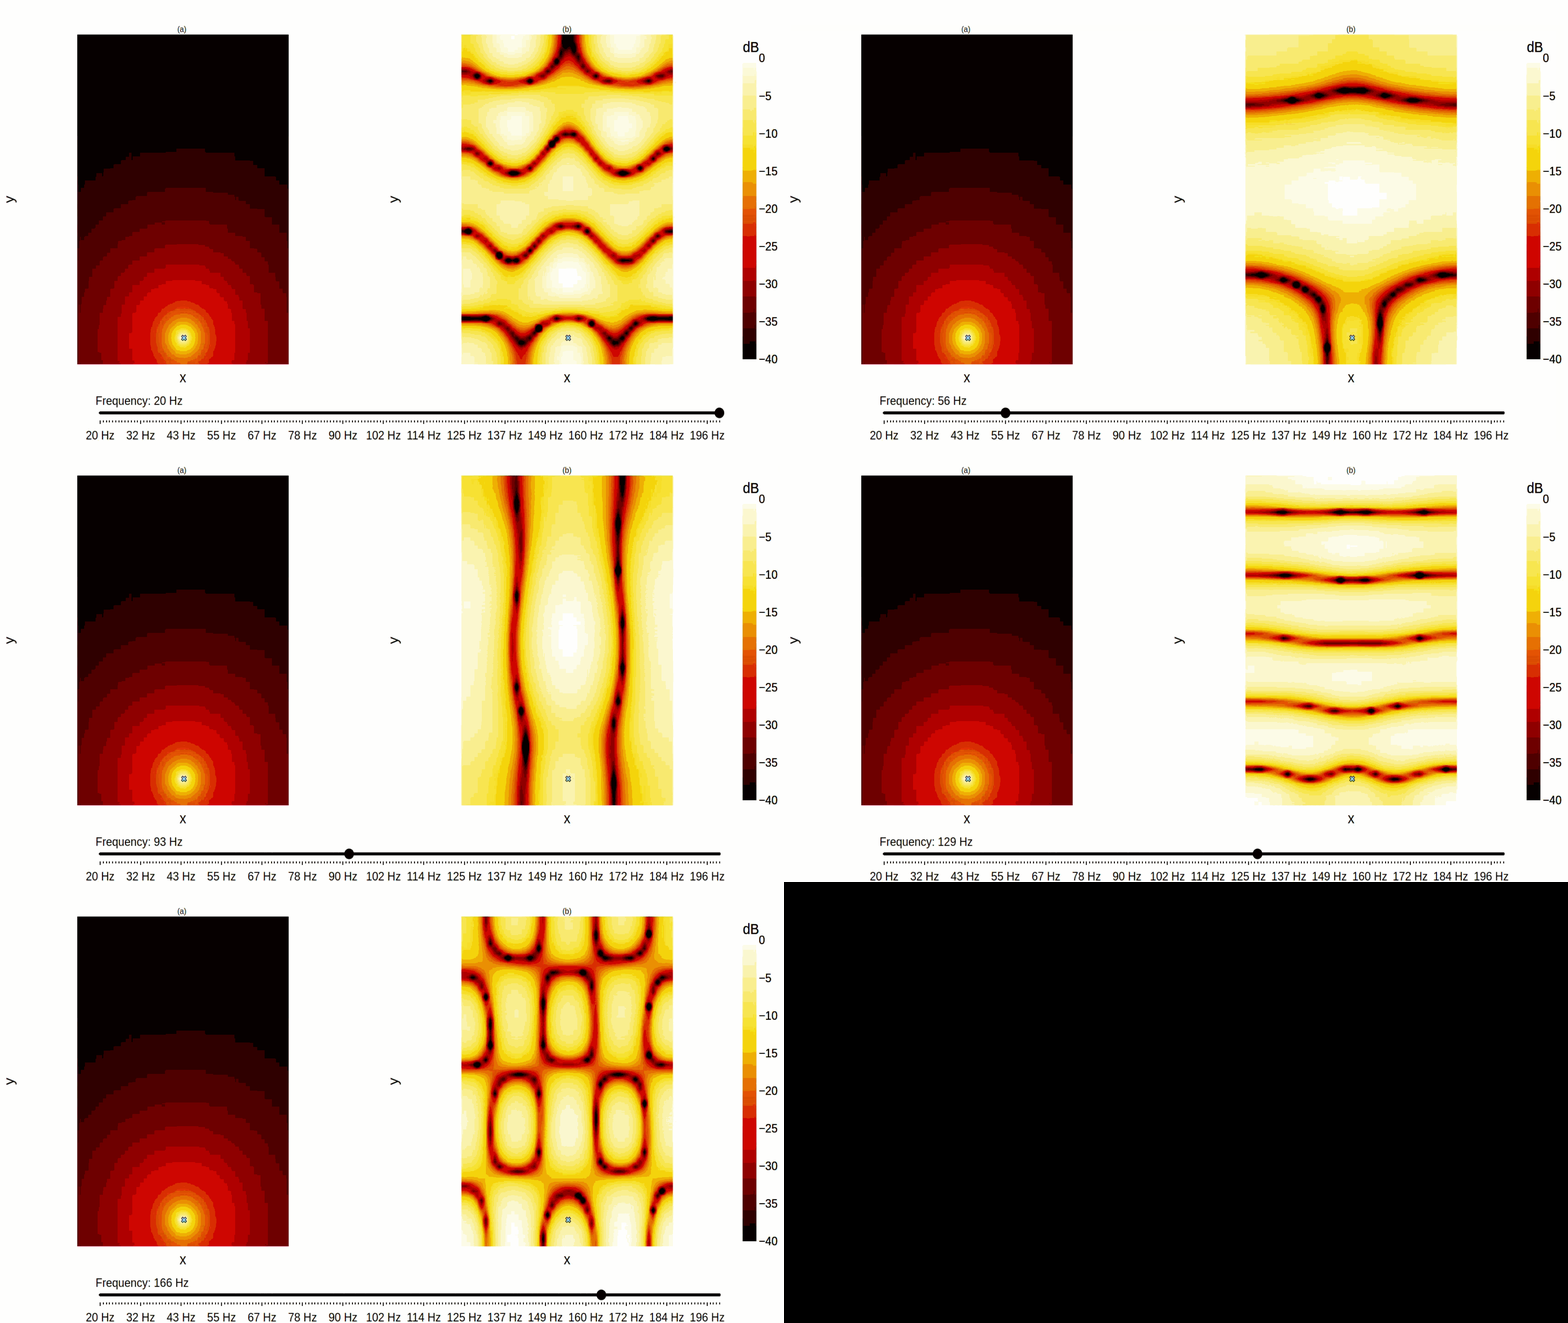
Figure 1. (a) acoustic pressure distribution in free space and (b) acoustic pressure distribution inside a room.
Optimum bass reproduction with WaveForming
WaveForming was first introduced at ISE 2023 and combines advanced multiple inputs - multiple outputs (MIMO) algorithms with an in-depth physical understanding of how sound waves propagate in a room. This patented technology offers unprecedented control over a room's acoustic response at low frequencies, virtually eliminating the modal signature of the room.
The animation below shows the general principle behind WaveForming. An array of subwoofers generate a perfect planar wavefront at the front of the room. This wavefront is guided by the room boundaries and propagates unaltered to the back of the room. When the wavefront reaches the back wall, it is absorbed by another array of subwoofers. During this process, the wavefront does not experience any perturbation due to boundary reflection or resonance. Therefore, from the point of view of a listener in the room, the experience is similar to free space reproduction.
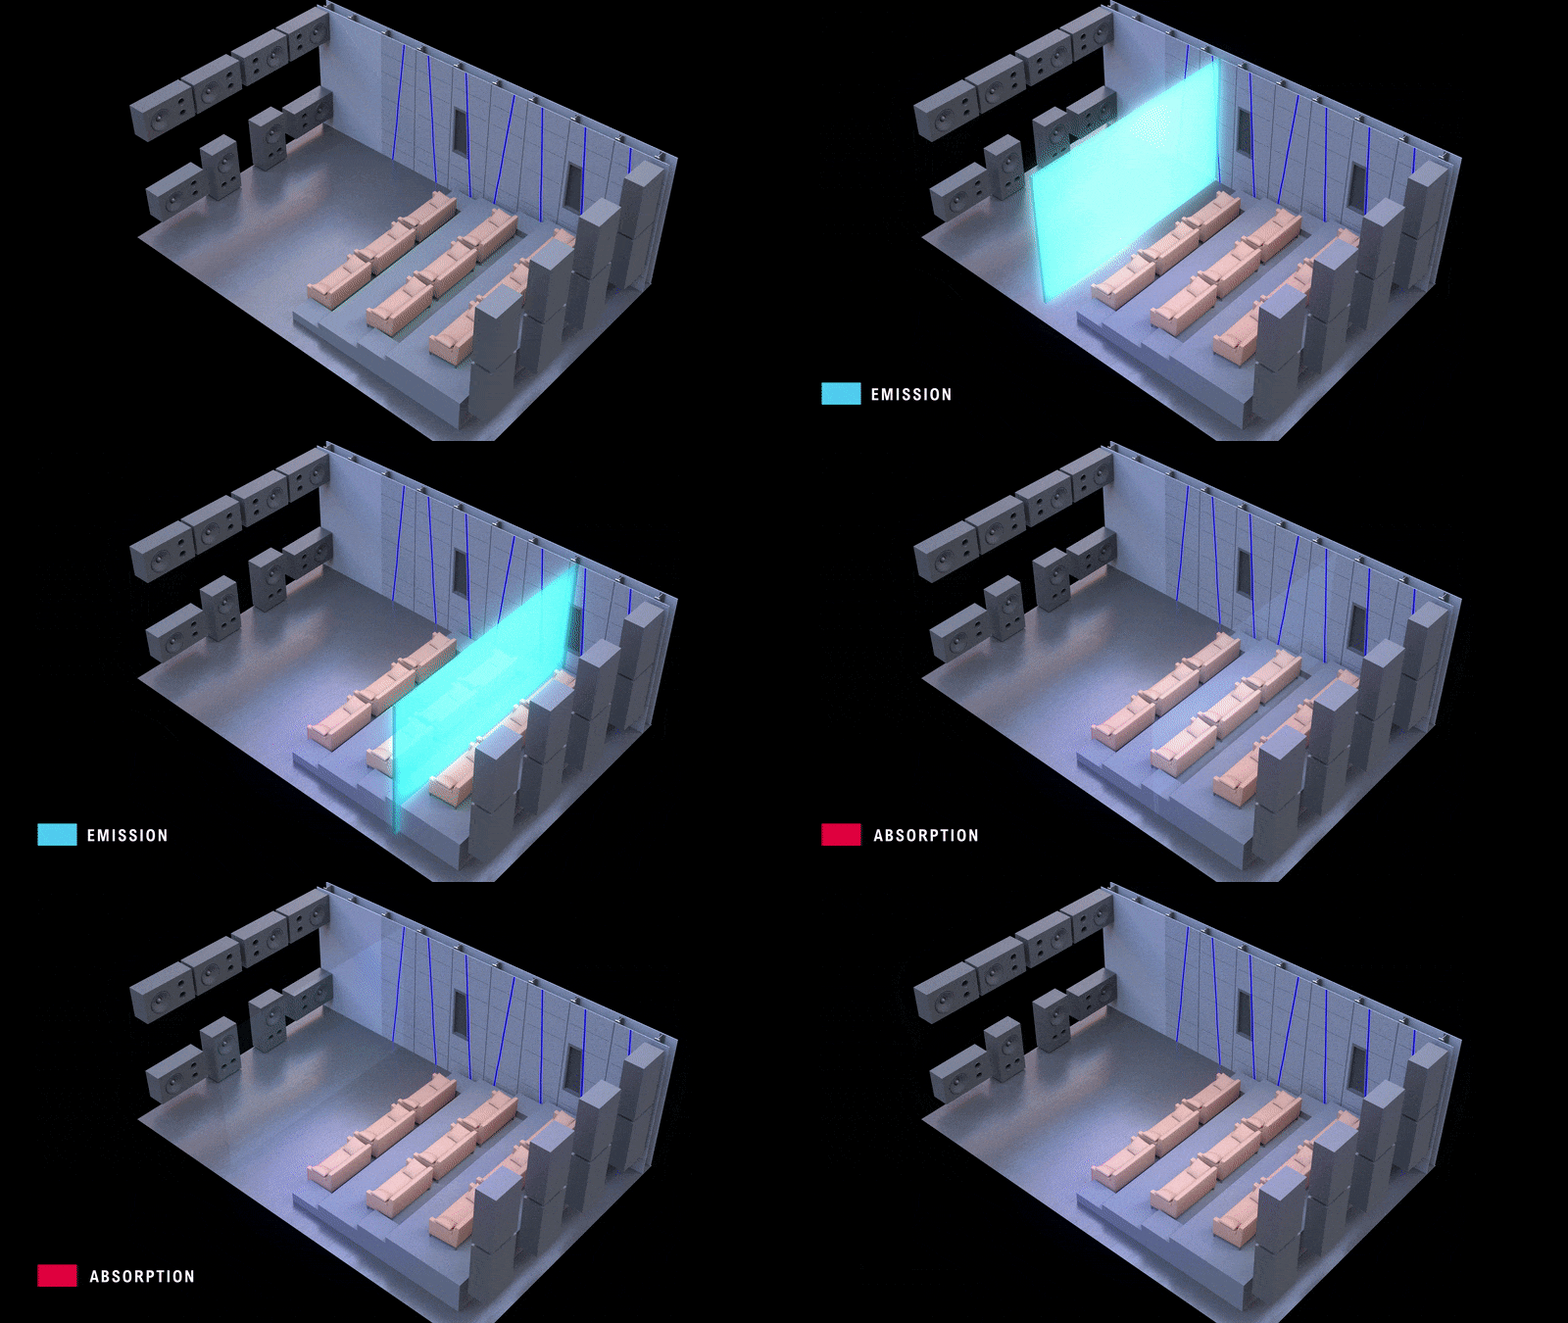
Figure 2. Illustration of the WaveForming principle.
By dealing with the causes (i.e. room modes) rather than the consequences, WaveForming offers more flexibility than other existing solutions. Compared to Double Bass Array (DBA), WaveForming is less strict in terms of subwoofer placement, and it adapts easily to complex room geometries and uneven sound absorption at walls while being more efficient in terms of room resonance control. It also handles a larger number of subwoofers and a bigger listening zone than the Multiple-Sub Optimizer (MSO) software, all while keeping the calibration process simple and reliable.
Based on an extensive research effort, Trinnov has published the guidelines for subwoofer layouts and the WaveForming tools, with the goal to help users to achieve optimal WaveForming performance.
This white paper aims to highlight the essential role of both the subwoofer positioning and the microphone grid placement used during the calibration phase. We illustrate this based on theoretical considerations and time-domain simulations, which enable an easier understanding of the physical phenomena involved.
A bit of theory
As discussed in our guidelines for subwoofer layouts, WaveForming reaches its best performance with a regular subwoofer layout. This is better understood by analysing the behaviour of the room transverse modes. The room can be considered as a waveguide with a rectangular cross-section. The emitters generate an acoustic field that can be represented as a weighted sum of transverse modes, see Figure 3(a). This sum consists of two types of modes:
- The planar mode, which is homogeneous across the room’s cross-section. A uniform wavefront is created at the front wall that propagates along the room at the free field sound speed, 343m/s. This is precisely what we want to achieve.
- The high-order modes, resulting from the waves bouncing iteratively off the boundaries of the waveguide (for instance between the 2 side walls). At specific frequencies depending on the room dimensions, the multiple bounces are perfectly synchronized and create a standing wave across the room section: a static pattern featuring nodes (positions with no sound pressure) and anti-nodes (positions of high sound pressure). Obviously these high-order modes are not spatially uniform and they should be avoided.
Furthermore, as the frequency increases, the multiple bounces of high-order modes are no longer in perfect synchronization allowing a slow propagation of the wave that accelerates with frequency. This process is described by the so-called group velocity, which represents the speed at which a transverse mode propagates sound energy through the room as a function of frequency. As an example, the group velocities of the planar mode and the first three high-order modes are represented in Figure 3(b). Variable group velocity causes lower frequencies to propagate slower than higher frequencies, resulting in a failure to deliver a compact wavefront and a tight impulse response to every listener.
With a regular subwoofer layout, we ensure that all the radiated energy is delivered to the room by the planar mode. This property is advantageous for two reasons:
- Exciting only the planar mode ensures that the amplitude of the incident wavefront remains constant and maximum at all positions in the room.
- The non-dispersive nature of the planar mode allows for the most compact possible wavefront, as all frequencies reach the listening zone simultaneously. This property eliminates any phase distortion introduced by the room and reduces the complexity of the WaveForming filters required to absorb the emitted wavefront.
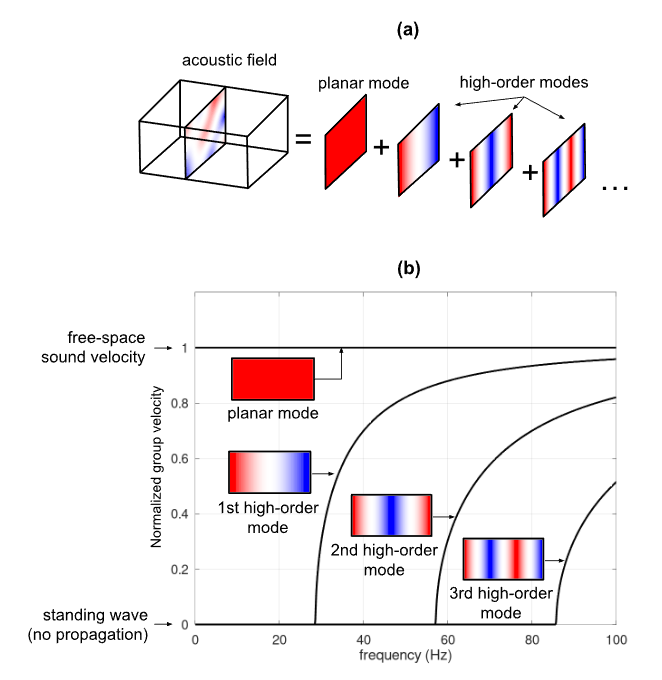
Figure 3. (a) The acoustic field in the transverse cross-section of the room is seen as a weighted summation of the planar mode and high-order modes (vertical modes are omitted for simplicity). (b) Group velocity as a function of frequency of the planar mode and the high-order modes.
The WaveForming algorithm leverages the concept of planar mode excitation with multiple emitting subwoofers to correct the modal behavior of a room in a wide range of situations, including complex geometries and non-ideal subwoofer layouts (see the guidelines for subwoofer layouts).
However an optimal subwoofer placement is fundamental to preventing potential acoustic issues during the wavefront emission step and to achieve optimal results. It also minimizes the risk of creating excessively long and complex acoustic filters that could ultimately lead to audible artifacts.
WaveForming performance with different subwoofer layouts
This section shows several acoustic simulations to illustrate the advantages of using the recommended regular layout over other layout types. The layouts under consideration are represented in Figure 4. The length, width and height of the room are, respectively, 6.7m, 4.75m, 3m. Blue circles show the position of the emitters, red circles show the position of the absorbers, and crosses represent microphone positions. Note that we used a much denser measurement grid than what is typically recommended for actual room calibrations. This approach minimizes potential uncertainties introduced by the measurement grid, allowing us to assess the influence of the subwoofer layout on WaveForming performance with higher accuracy.
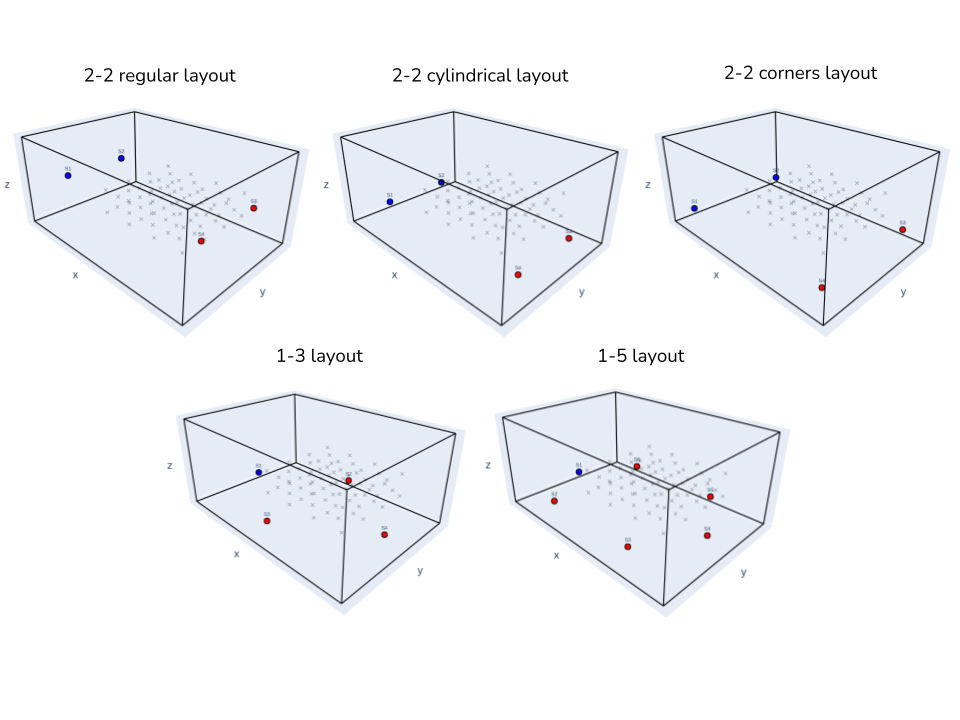
Figure 4. Subwoofer layouts under consideration.
Following our subwoofer placement guidelines, the recommended layout for this room is the 2-2 regular layout, with the subs positioned flush to the front and rear walls, at ½ of the room height, ¼ and ¾ of the room width. This layout ensures planar mode excitation (and therefore optimum WaveForming performance) up to at least 100Hz. The performance of this layout will be compared to the following two single emitter-multiple absorbers layouts:
- 1-3 layout: One emitter is placed at the midpoint of the front wall's width, while three absorbers are positioned at the midpoints of the left, right, and back walls, respectively. All subwoofers are positioned 50 cm above the ground;
- 1-5 layout: One emitter is placed at the midpoint of the front wall's width. Four absorbers are placed at ¼ and ¾ of the left and right walls' widths, and another absorber is placed at the midpoint of the rear wall's width. All subwoofers are positioned 50 cm above the ground;
and two multiple emitters-multiple absorbers layouts:
- 2-2 cylindrical layout: identical to the 2-2 regular layout, but with the subs positioned 50 cm above the ground. The term cylindrical refers to the fact that this configuration uses the room to generate a cylindrical wavefront;
- 2-2 corners layout: 2 emitters-2 absorbers layout with the subs positioned at the room corners (50 cm above the ground and 50cm away of the side walls);
Comparison with Single Emitter - Multiple Absorbers layouts
Figure 5 shows the simulated acoustic field when WaveForming is applied in the case of the 1-3 layout (left) and the 2-2 regular layout (right). The 1-3 layout shows a spherical wavefront that radiates energy in all directions because of the excitation of high-order modes. As a result, the 1-3 layout shows a poor control of the acoustic field, with strong spatial variations and sound waves bouncing for a long time. In contrast, with the 2-2 regular layout, we obtain a planar wavefront that propagates compactly through the room. After reaching the back wall, this wavefront is mostly cancelled out by absorbers and only a small portion of incident energy remains in the room afterwards.
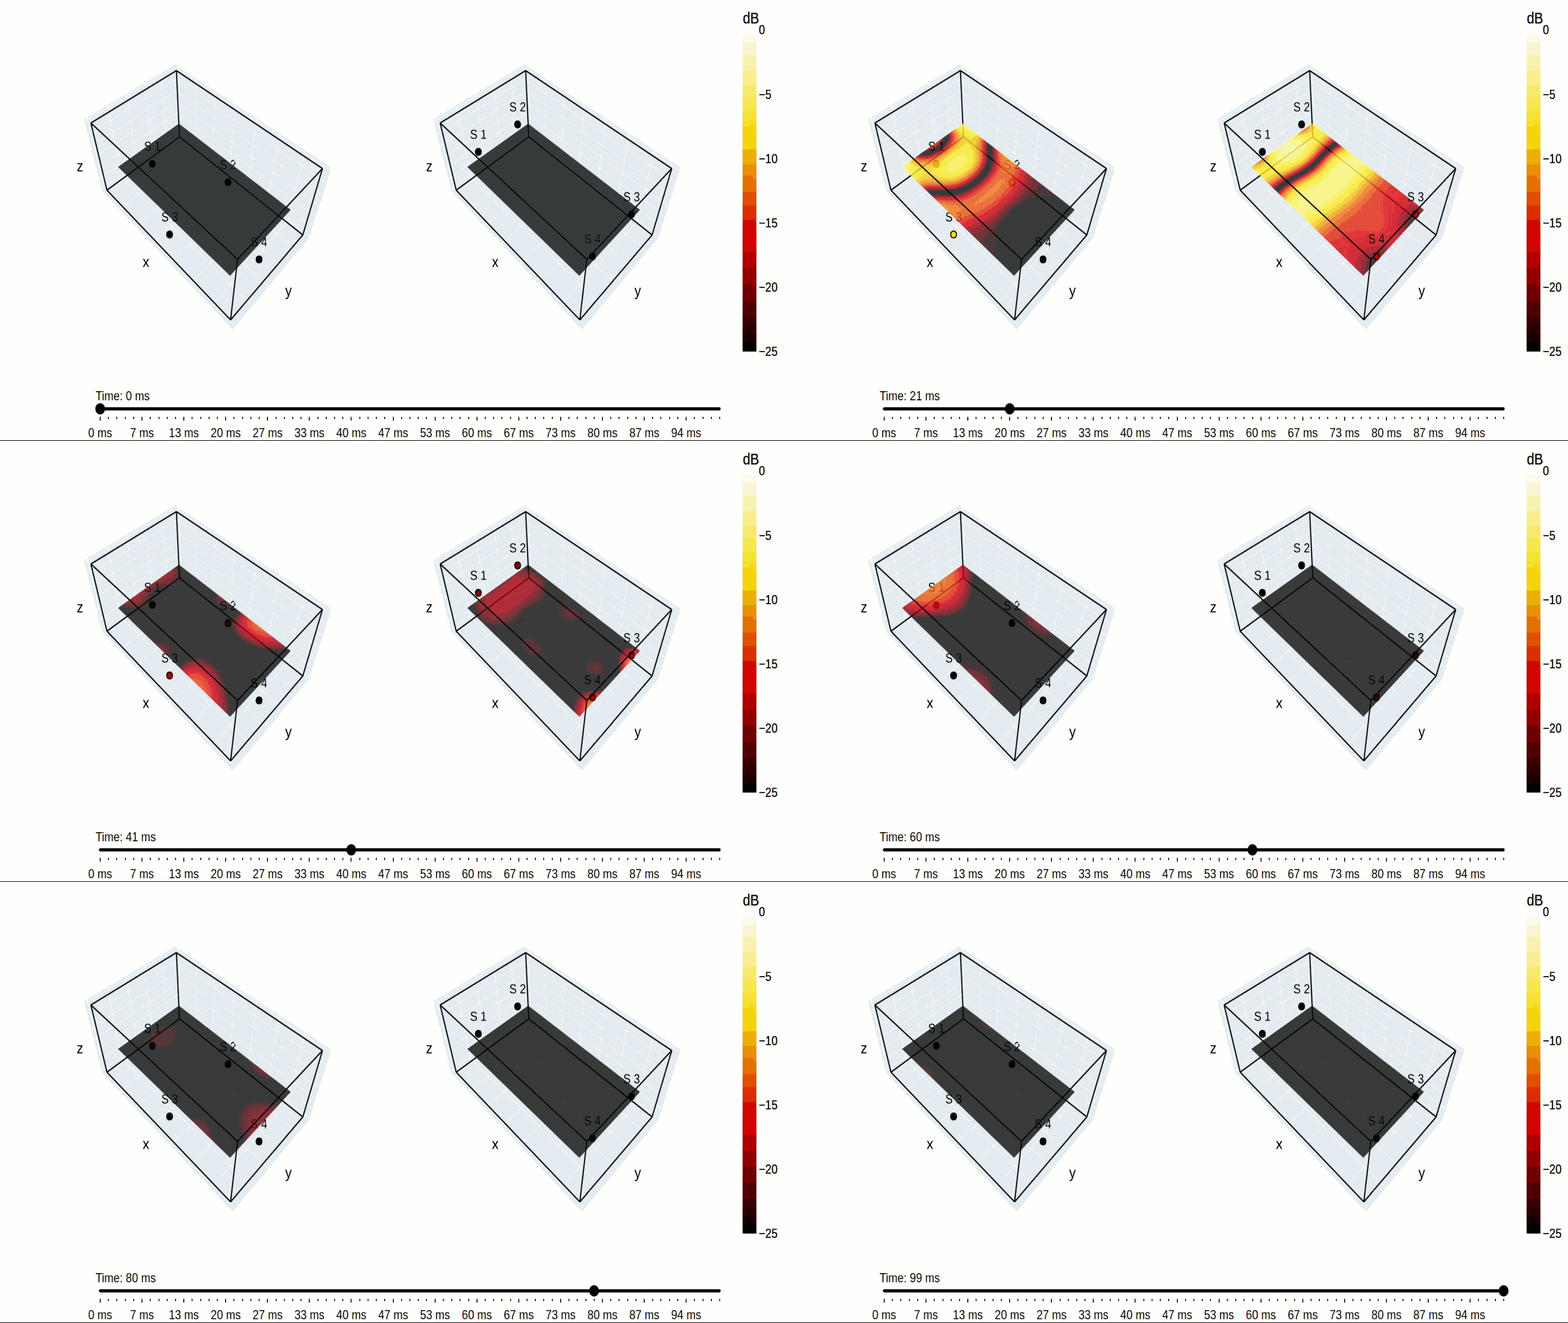
Figure 5. Acoustic field with WaveForming obtained with (left) the 1-3 layout and (right) the 2-2 regular layout
Figure 6 compares the WaveForming performance between the 1-5 layout (left) and the 2-2 regular layout (right). By increasing the number of absorbers, the 1-5 layout provides better decay control, which becomes comparable to the decay achieved with the regular 2-2 layout. However, the 1-5 layout is unable to produce a homogeneous wavefront in the room due to the excitation of high-order modes. This causes significant variations in the response at different points in the room, resulting in inconsistent bass reproduction throughout the listening zone.
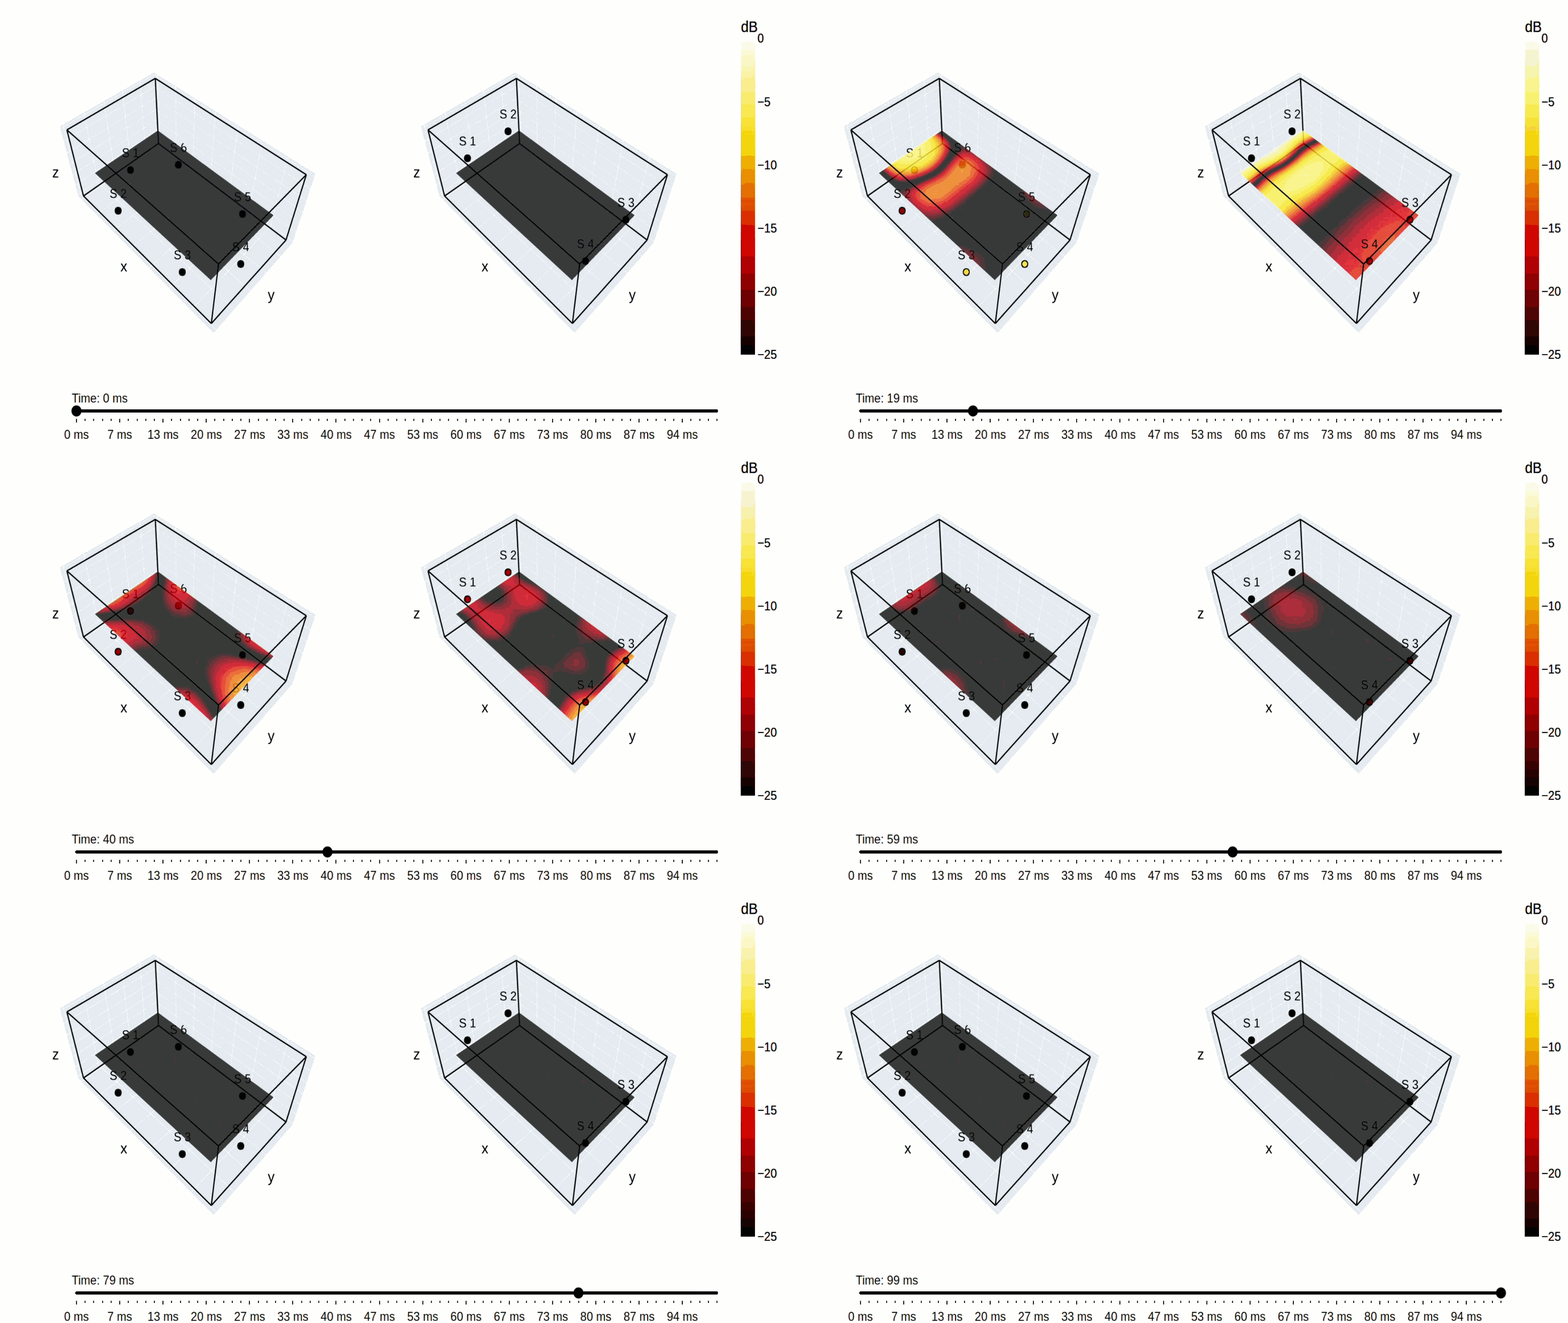
Figure 6. Acoustic field with WaveForming obtained with (left) the 1-5 layout and (right) the 2-2 regular layout
These results demonstrate that generating a planar wavefront significantly simplifies the task of the absorbers, minimizing the risk of generating audible artifacts. In this example, the 1-5 layout requires five absorbers to achieve a similar decay time as the 2-2 regular layout, which uses only two absorbers. Additionally, the simulation assumes that all emitters and absorbers have the same bass extension. In situations where this is not the case, for instance, when some of the absorbers are satellites rather than subwoofers, reducing the decay at the lowest frequencies becomes even more challenging if not impossible.
Comparison with Multiple Emitters - Multiple absorbers layouts
Figure 7 shows the simulation corresponding to the 2-2 corners layout. Compared to the previous 1-3 layout, which also has 4 subwoofers, we observe that using two emitters reduces the amount of reflections and also reduces the decay time. However, the performance is still not as good as that of the 2-2 regular layout. Notice that the emitted wavefront is not planar, meaning that high-order room modes are excited. This degrades the seat-to-seat consistency across the room and generates a longer decay compared to the 2-2 regular layout.
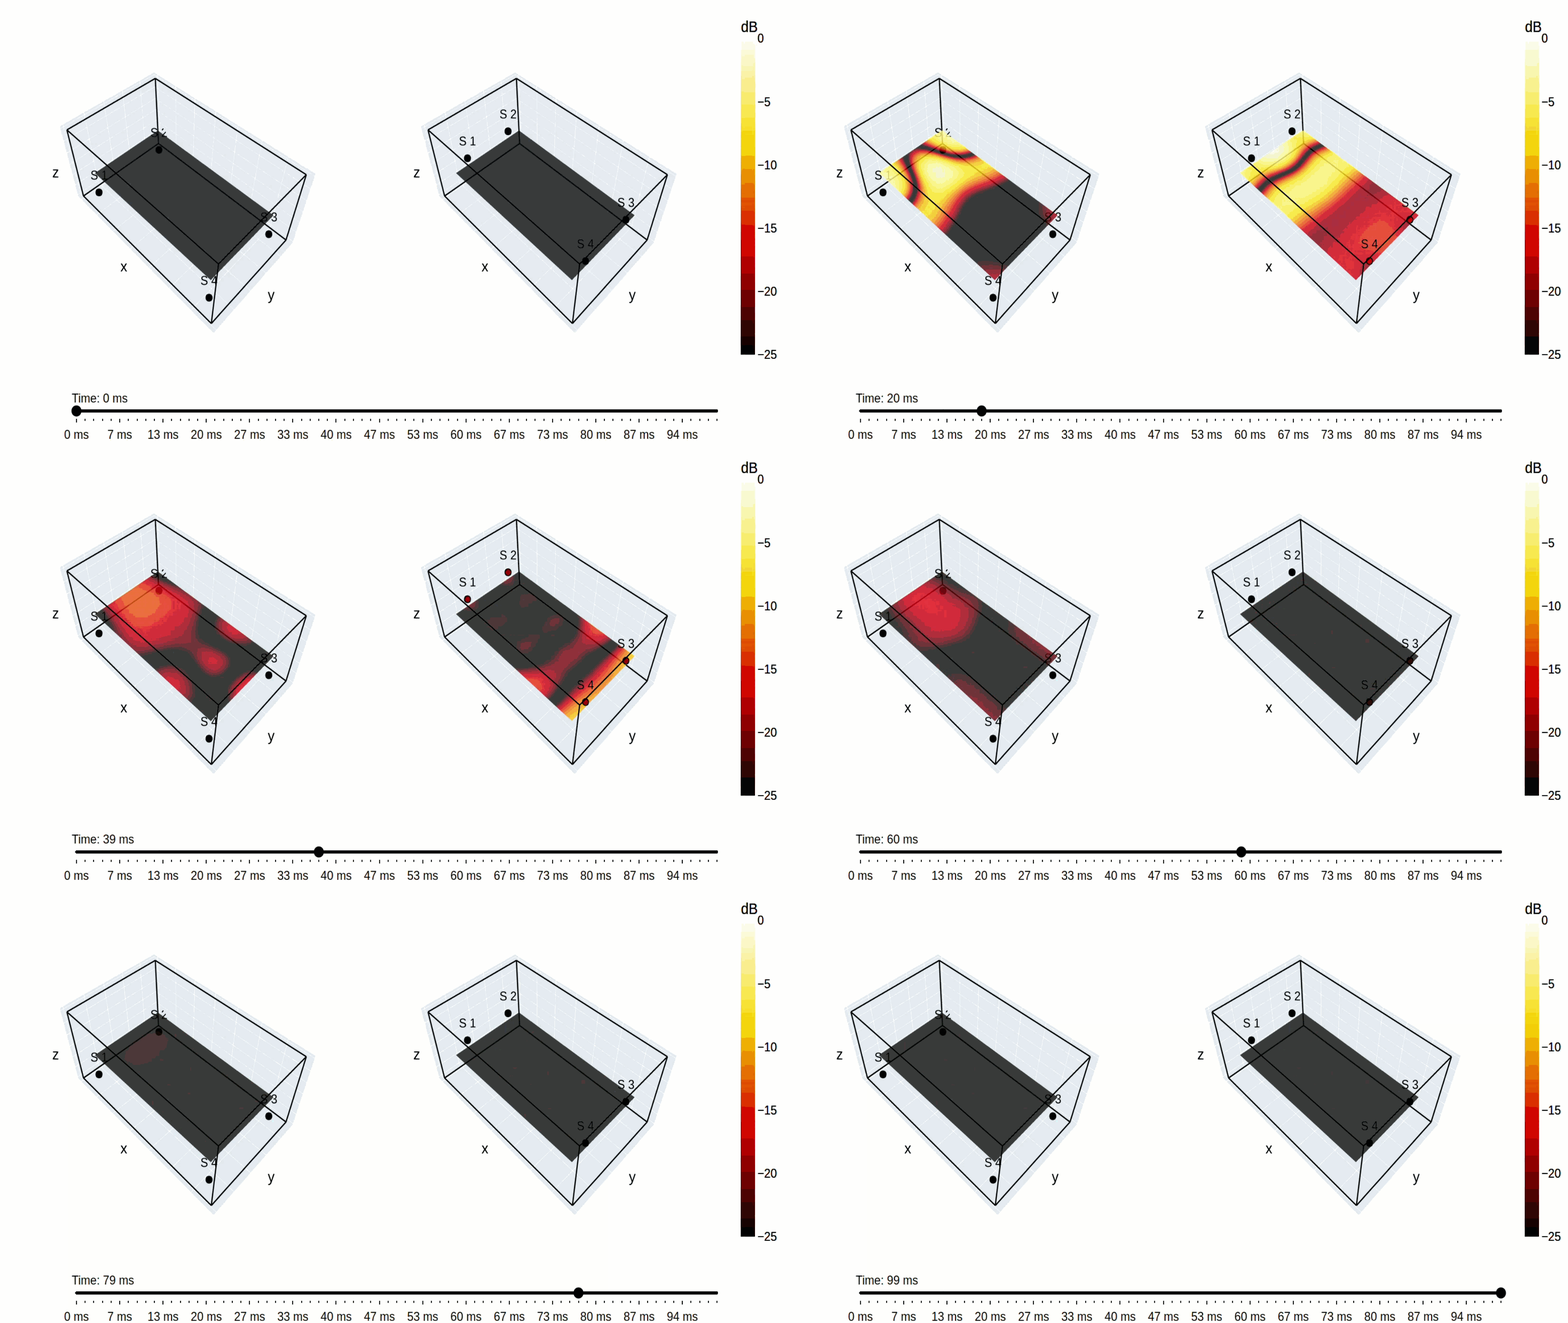
Figure 7. Acoustic field with WaveForming obtained with (left) the 2-2 corners layout and (right) the 2-2 regular layout
Figure 8 illustrates the results obtained with the 2-2 cylindrical layout. This layout uses the room to generate a cylindrical wavefront, which is constant along the room width. This layout is interesting because it provides good control of the lateral room modes, though it does not prevent the excitation of vertical modes. Consequently, the first wavefront remains planar in the horizontal direction but a reflection appears after 43 ms corresponding to the contribution of vertical modes. Although both configurations give comparable uniformity, the excitation of these modes in the 2-2 cylindrical layout gives a slightly longer decay time.
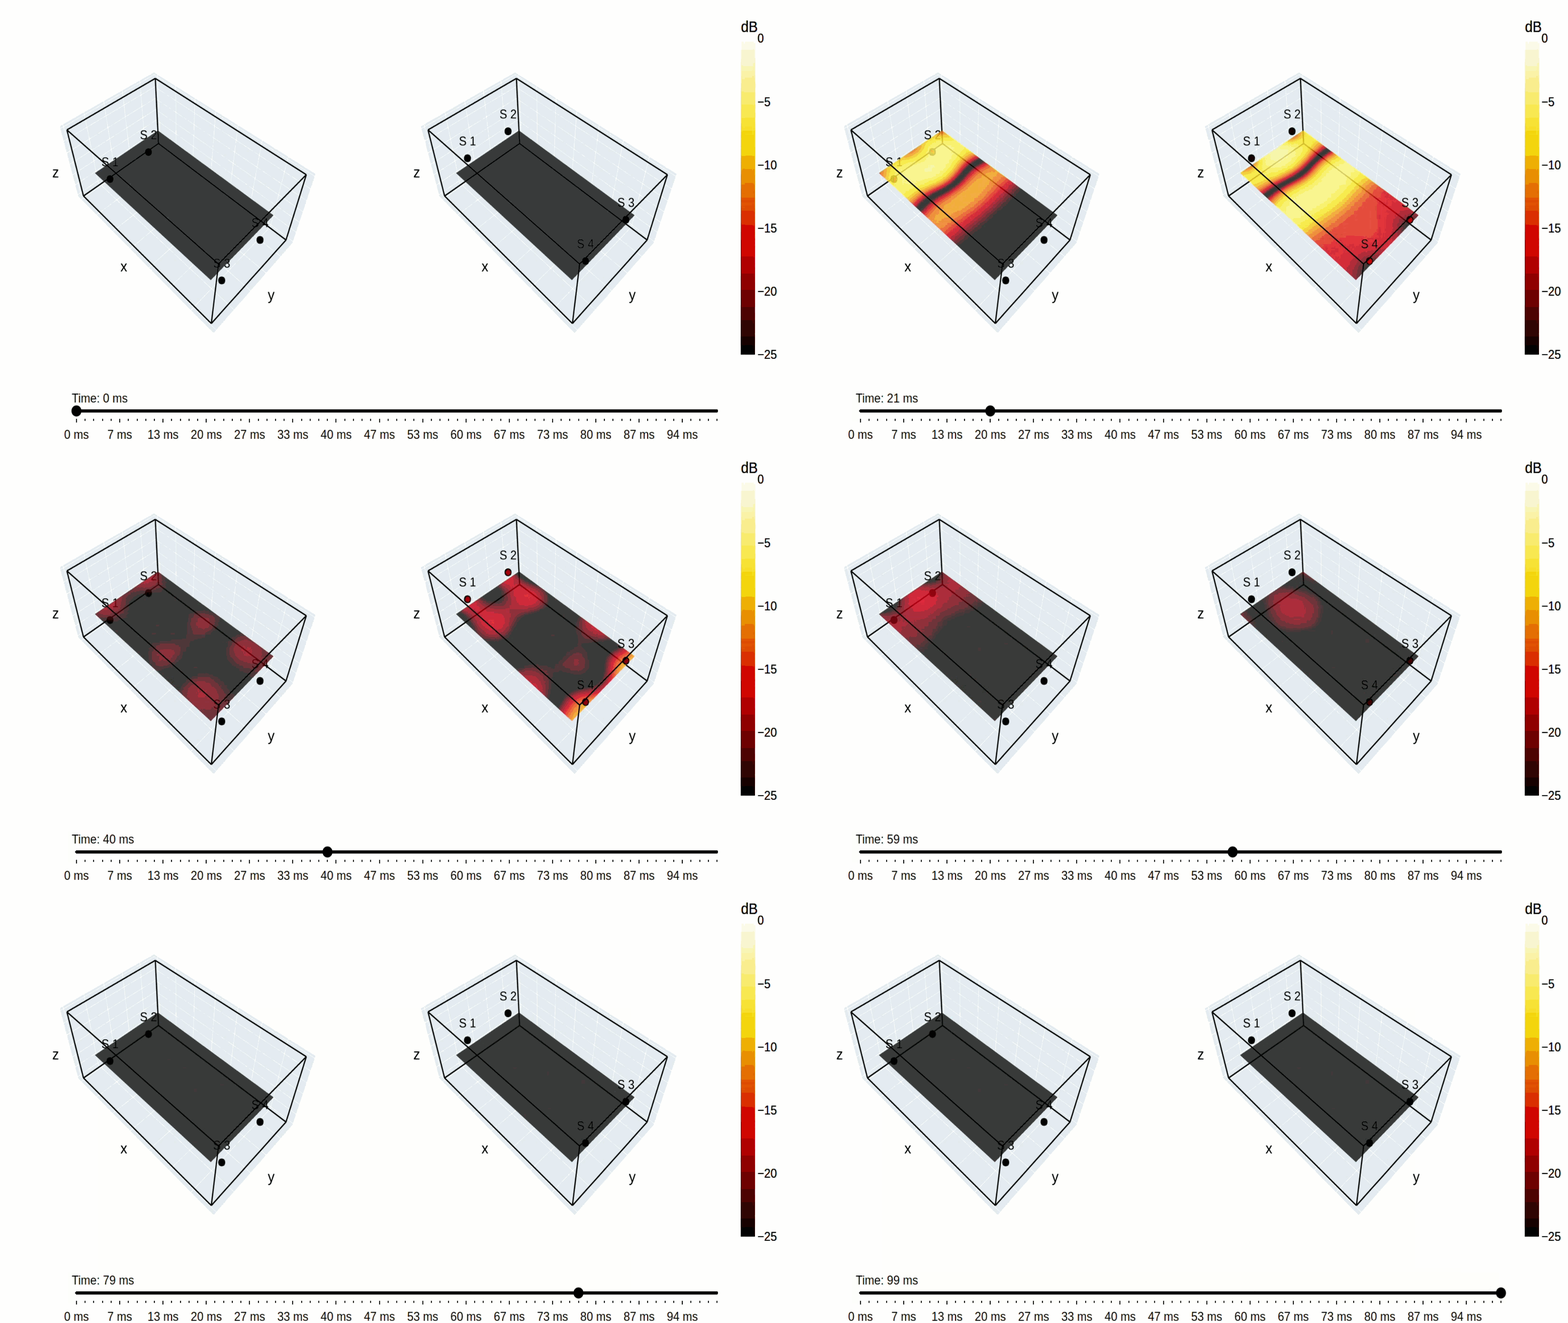
Figure 8. Acoustic field with WaveForming obtained with the 2-2 cylindrical layout (left) and the 2-2 regular layout (right)
Maximum uniformity and maximum amplitude
Placing the subs at the regular position not only provides the most uniform sound reproduction in the room, but it also maximizes the pressure amplitude delivered to the audience. This is because all frequencies reach a given seating position at the same time. To illustrate this, Figure 9 shows the acoustic pressure recorded on a horizontal line located at ear level, 4.5 meters away from the front wall. The results correspond to the case where WaveForming is turned on. The figure compares the time evolution of the acoustic field obtained with the 1-3 layout, Figure 9(a), and the 2-2 regular layout, Figure 9(b). Both figures are normalized to the maximum amplitude of Figure 9(b). Note that the 2-2 regular layout shows a compact and uniform impulse response, while the 1-3 layout shows a much more complex response, with a longer and position-dependent amplitude decay.
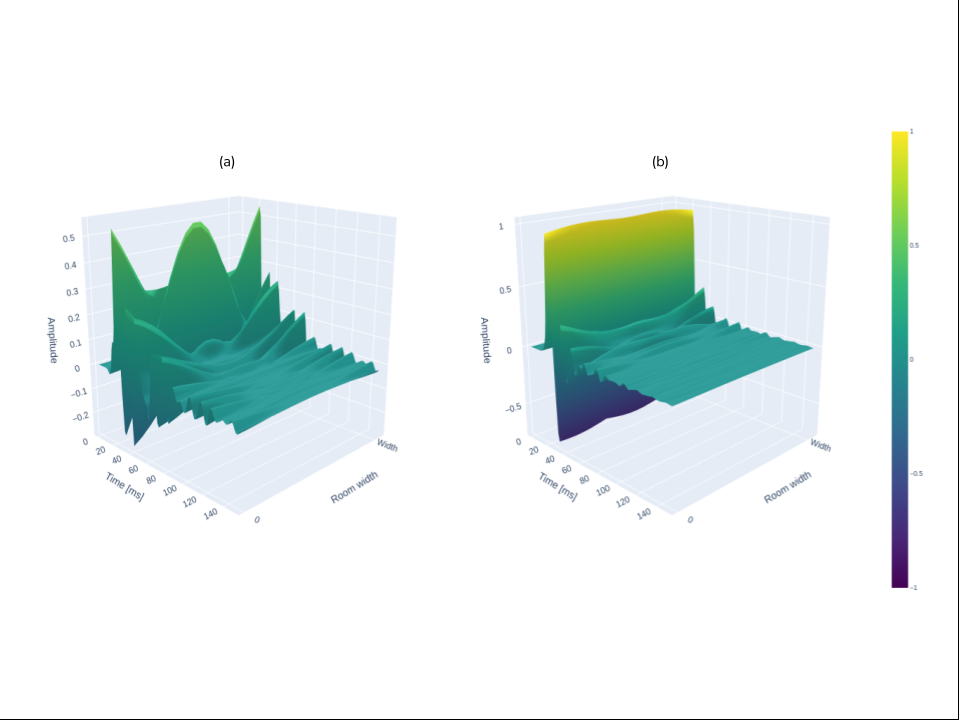
Figure 9 : 3D representation of the impulse response for an xz-cut of the room at 4.5 meters from the front wall for (a) the 1-3 layout, and (b) the 2-2 regular layout (right).
Figure 10 shows a snapshot of the maximum of the impulse responses along the room width for all the subwoofer layouts under consideration. In relation to Figure 9, this corresponds to a cutline of the graphs at the time when the amplitude reaches its maximum, (approximately 20ms). As expected, the 2-2 regular layout exhibits both the best seat-to-seat consistency and the maximum amplitude.
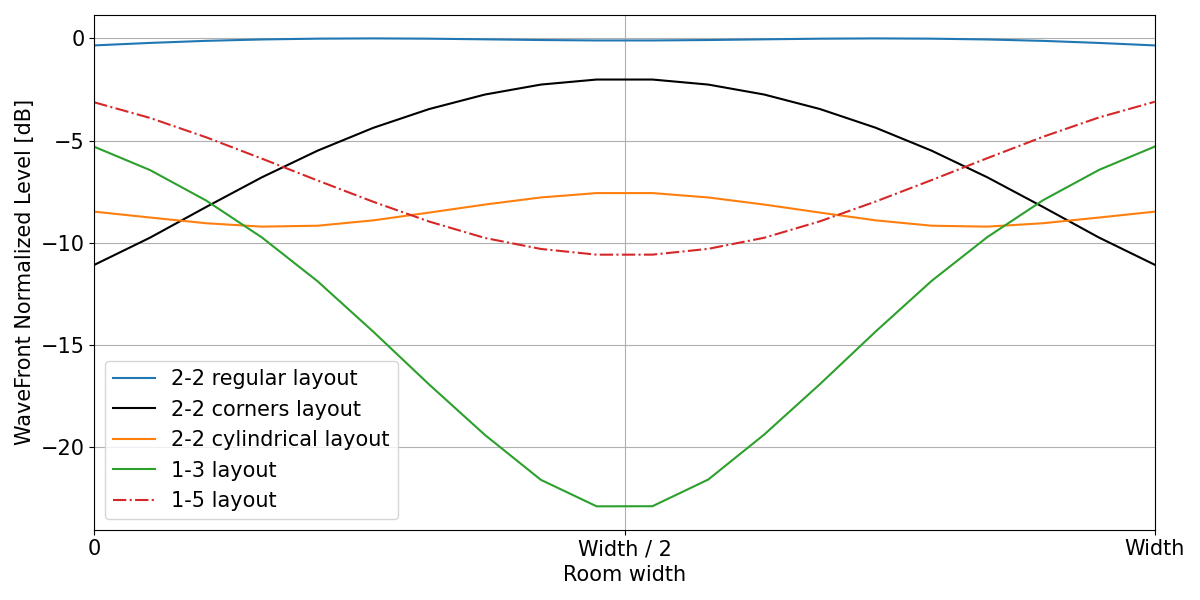
Figure 10 : Cutlines of the acoustic field at the instant when the amplitude reaches its maximum for the different layouts under consideration.
Properly sampling the acoustic field to achieve the best performance
With WaveForming the goal is to optimize the acoustic field, not solely at specific listening positions, but continuously throughout the widest possible volume of the room. To achieve this, WaveForming needs to retrieve sufficient information about the acoustic field in the room. In practice, this is accomplished by sampling the field across the listening zone and beyond it when possible. To obtain optimal correction filters, the calibration zone is carefully selected to be broad enough to gather the necessary information, while avoiding unwanted reflections.
If the calibration zone covers only a small portion of the room, WaveForming will optimize the acoustic field within this zone. However, since the acoustic field is not controlled in the entire room, the algorithm may end up using complex optimization filters that remain active over longer periods of time, in order to prevent the reverberated sound from entering the calibration zone at later times. This sustained filtering effort could ultimately lead to audible artifacts and a suboptimum bass reproduction.
The simulations in Figure 12 highlight the importance of the size of the calibration zone.
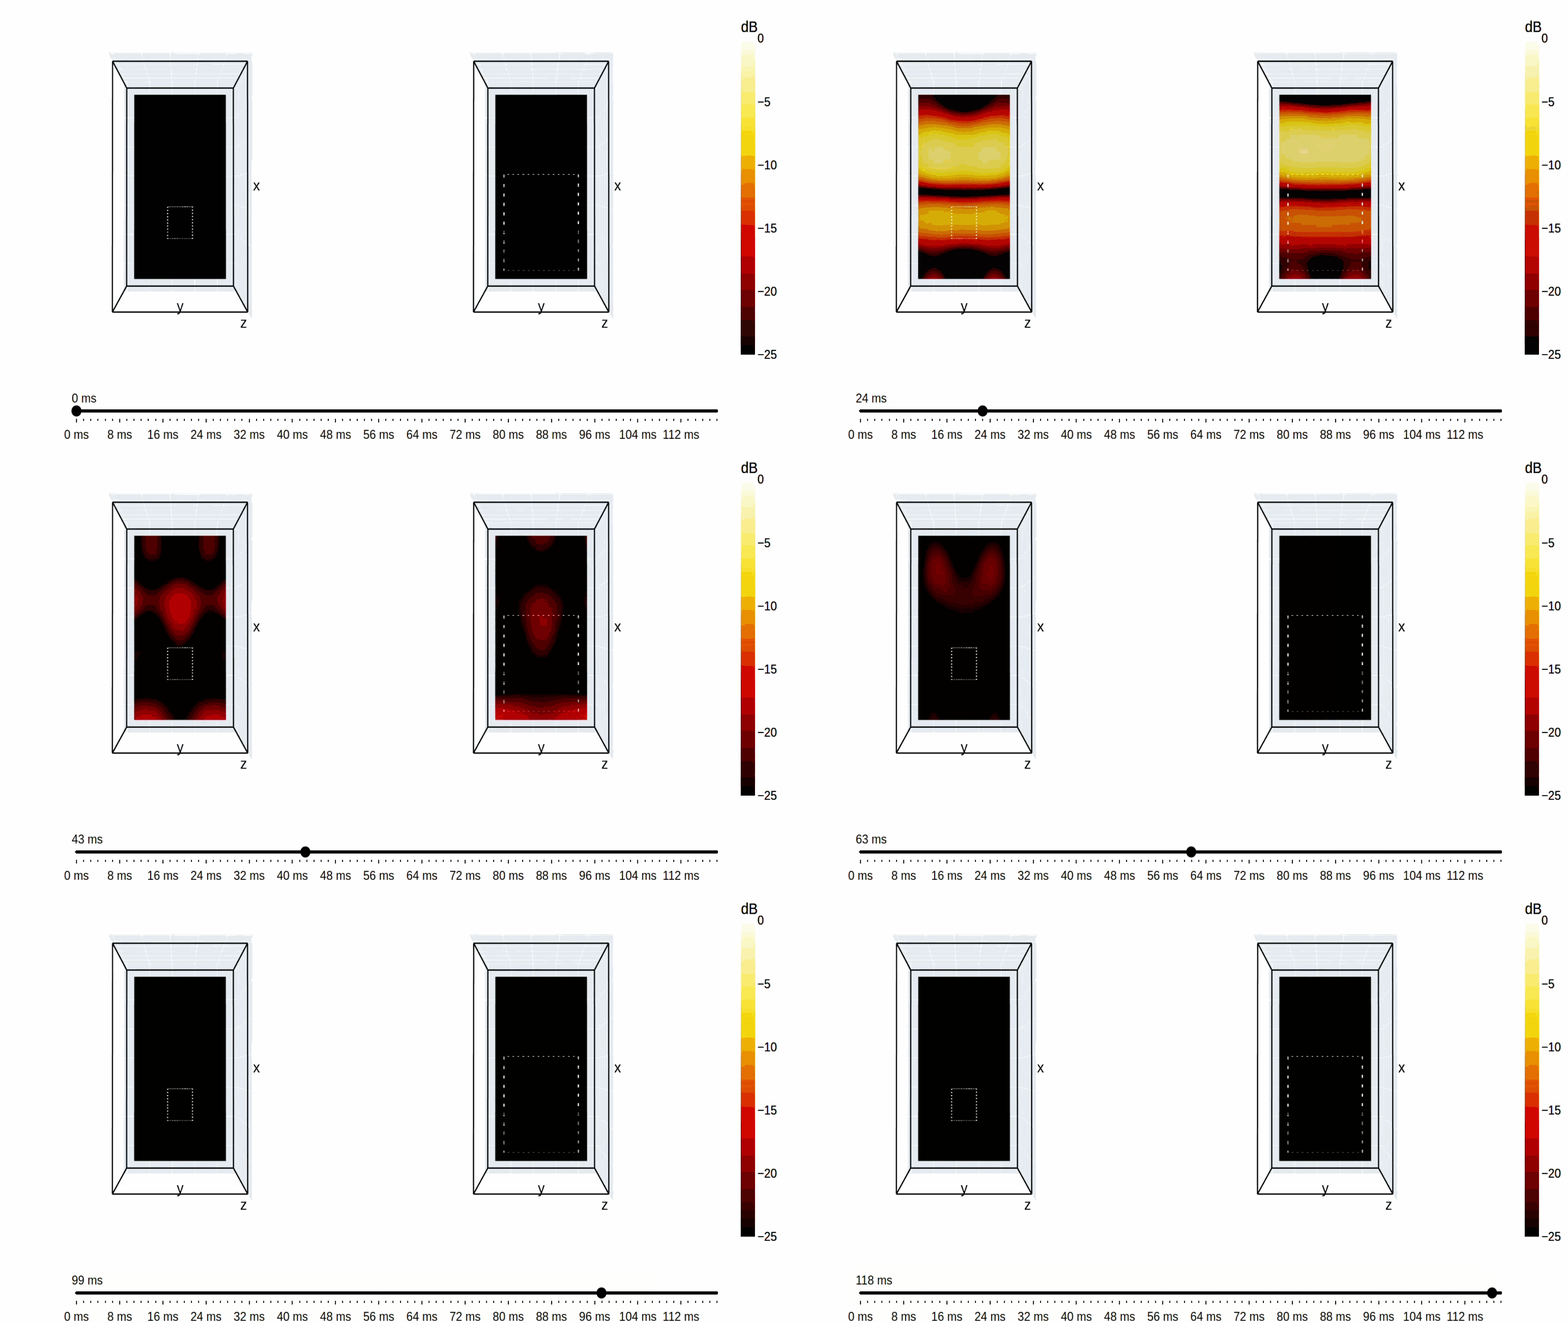
Figure 12 : WaveForming acoustic field with calibration zones (dashed rectangles) of different sizes.
In the simulation on the left, the calibration zone (dashed rectangle) occupies only 1 m³, whereas in the animation on the right, the calibration zone spans 9 m³. If one looks at what happens inside the calibration zone only, the acoustic field vanishes in both cases after the initial arrival of the emitted wavefront. However, the animation on the left reveals a much longer decay outside the calibration zone, whereas in the animation on the right, the acoustic field decays more quickly and uniformly throughout the room.
WaveForming performance in actual rooms
The above numerical and theoretical considerations describe quite accurately the actual behavior of WaveForming in most real-life situations, not just the ideal rectangular shoebox rooms. This is because the shortest wavelengths within the WaveForming band (3.4m at 100Hz) is much larger than the geometrical features of the furniture typically found in a room. To demonstrate this, the current section shows some experimental results obtained in our laboratory test room. The room is 5.4m long, 4.5m wide and 2.7m high, and it is furnished with a couch, a desktop, an office chair, and two shelves. In addition the side walls are made out of a lightweight construction material, and have several columns and irregularities, far from the ideal waveguide representation considered in theory.
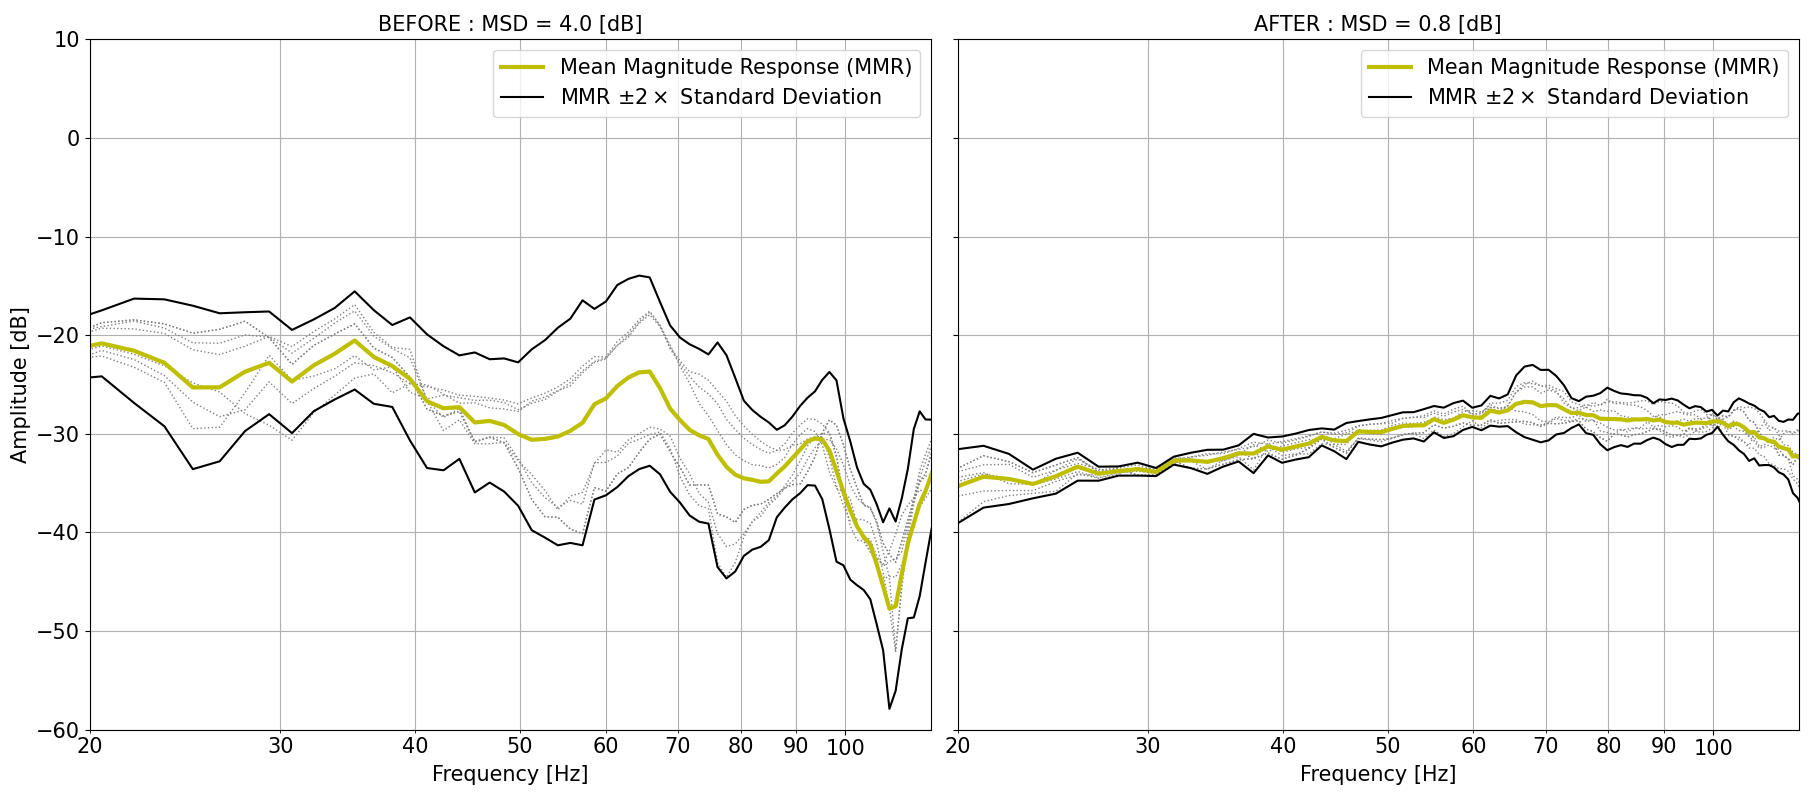
Figure 13 : Magnitude of the frequency responses, obtained before (left) and after (right) WaveForming calibration. The dotted lines represent the individual responses at each calibration point, the yellow line represents the average response, and the bold black lines represent twice the standard deviation.
Figure 13 illustrates the magnitude of the frequency responses at each calibration point before (left panel) and after optimization (right panel). The dotted lines represent the individual responses at each calibration point, the yellow line represents the average response, and the thick black lines represent twice the standard deviation. Before optimization, the frequency responses show several peaks corresponding to room modes at 35 Hz, 65Hz and 95Hz, and we observe strong amplitude variations across the different calibration points. After WaveForming is applied, the resonance peaks are eliminated and the frequency responses become remarkably similar. Specifically, WaveForming reduces the MSD by more than 3 dB, dropping from 4 dB to only 0.8 dB.
With respect to the RP22 - Immersive Audio Design Recommended Practice seat-to-seat consistency rating, WaveForming significantly enhances the acoustic performance of the room, improving from level 2 to level 4, the highest possible rating.
For a better representation of the WaveForming performance in both the frequency and time domains, Figure 14 shows a wavelet spectrogram of the before and after responses at the RSP. The after response exhibits a much faster decay across all frequencies compared to the before response, enabling a tight and impactful bass reproduction in the room.
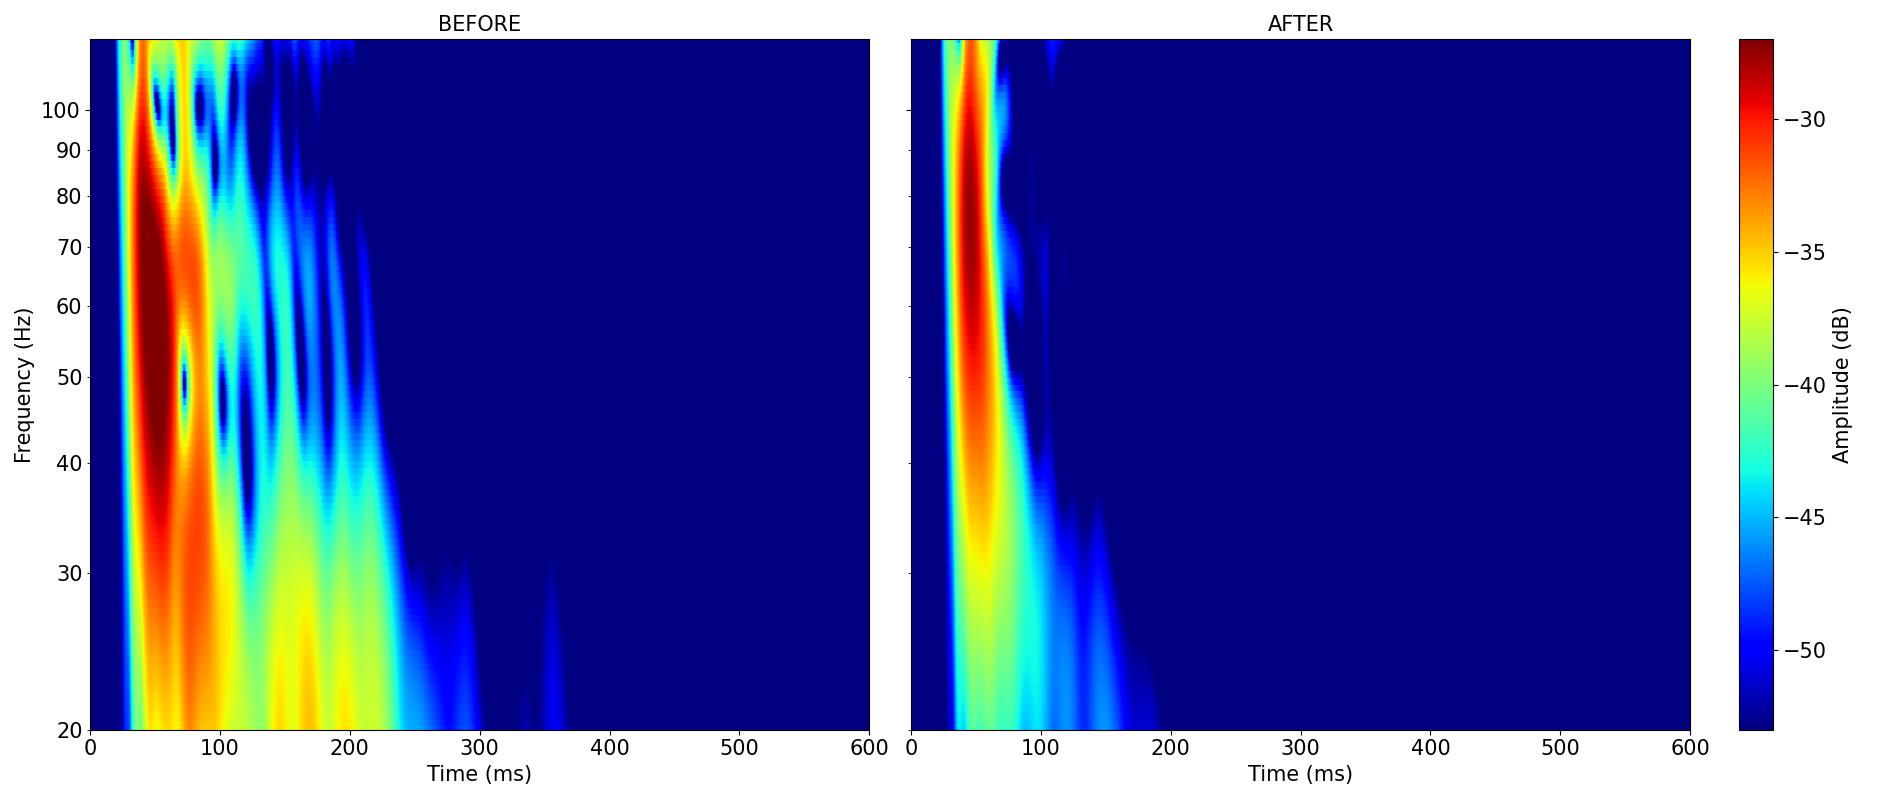
Figure 14 : Wavelet spectrogram of the before (left) and after (right) responses at the RSP.
Finally, Figure 15 shows the DT60 of the before (blue line) and after (green line) responses at the RSP. The graph reveals a huge decay reduction of approximately 200-400 ms across the 30-100 Hz frequency band. This strong decay reduction is particularly remarkable given that conventional passive acoustic treatments are very inefficient at addressing such long wavelengths.
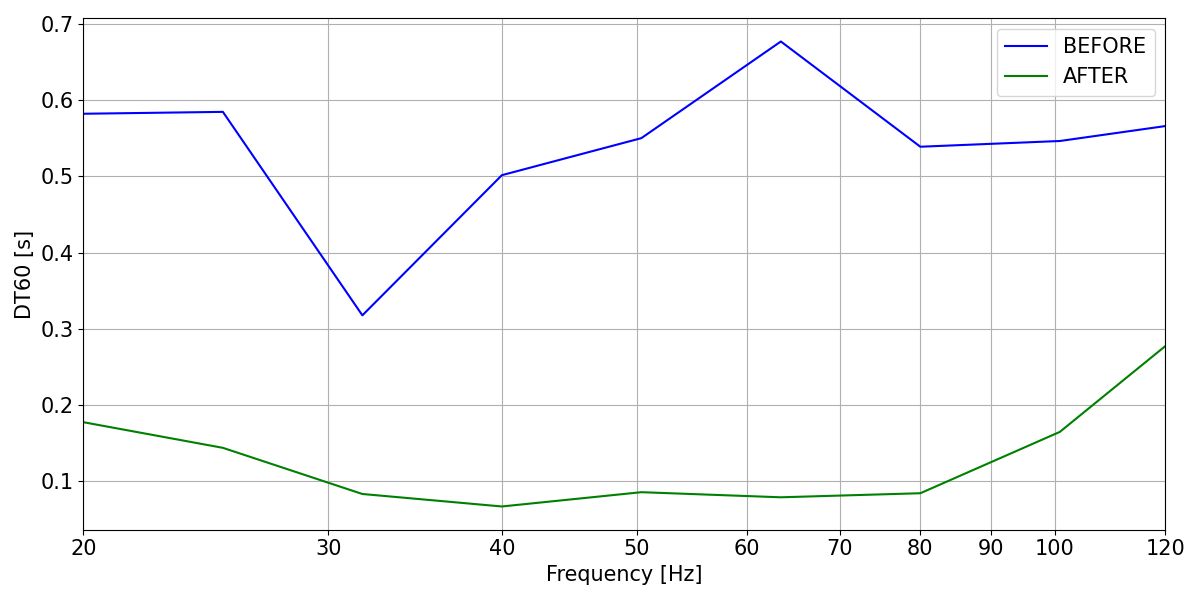
Figure 15. DT60 of the before (blue line) and after (green line) responses at the RSP.
Conclusion
WaveForming offers its users the ability to experience the tightest and most impactful bass reproduction indoors, similar to what can be achieved outdoors.
While this white paper has focused on shoebox geometries to more easily illustrate the theoretical concepts behind WaveForming, these principles remain valid even in more complex, real-world scenarios, such as furnished rooms with non-ideal layouts.
By eliminating the modal contribution of the room, WaveForming consistently delivers a neutral acoustic response, with minimal amplitude and phase distortion coming from the room. With the room under control, WaveForming offers a variety of settings to fine-tune the final result based on the user's personal preferences.
What’s next?
With WaveForming, we enter the world of complete acoustic control over a room. Still, this technological breakthrough is at the early stage of development and it will require many years of research to deploy its full potential. At Trinnov, we will continue to combine a deep understanding of the physical behavior of sound in a room with advanced signal processing techniques to push the boundaries of what is possible in active room correction and to offer the best listening experience to our customers.

