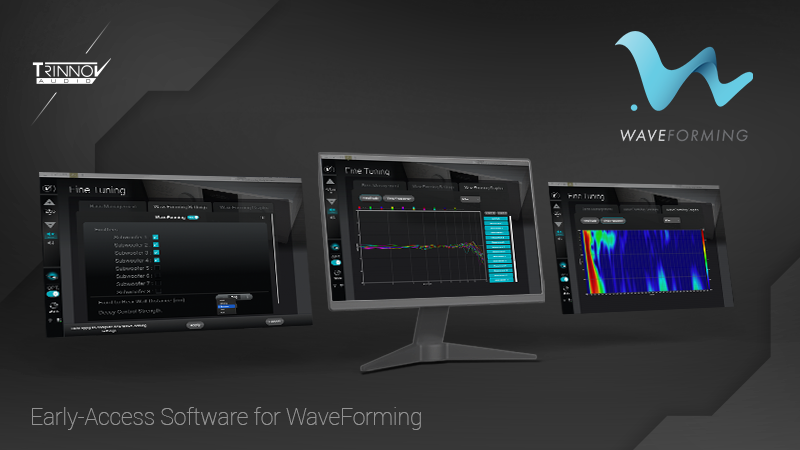
In November, our research team provided a new software version as part of the early access program of WaveForming.
This software release, only available for compliant project and upon request by WaveForming qualified dealers, provides a number of improvements that significantly simplify the entire calibration, configuration and fine-tuning of WaveForming.
WaveForming Settings
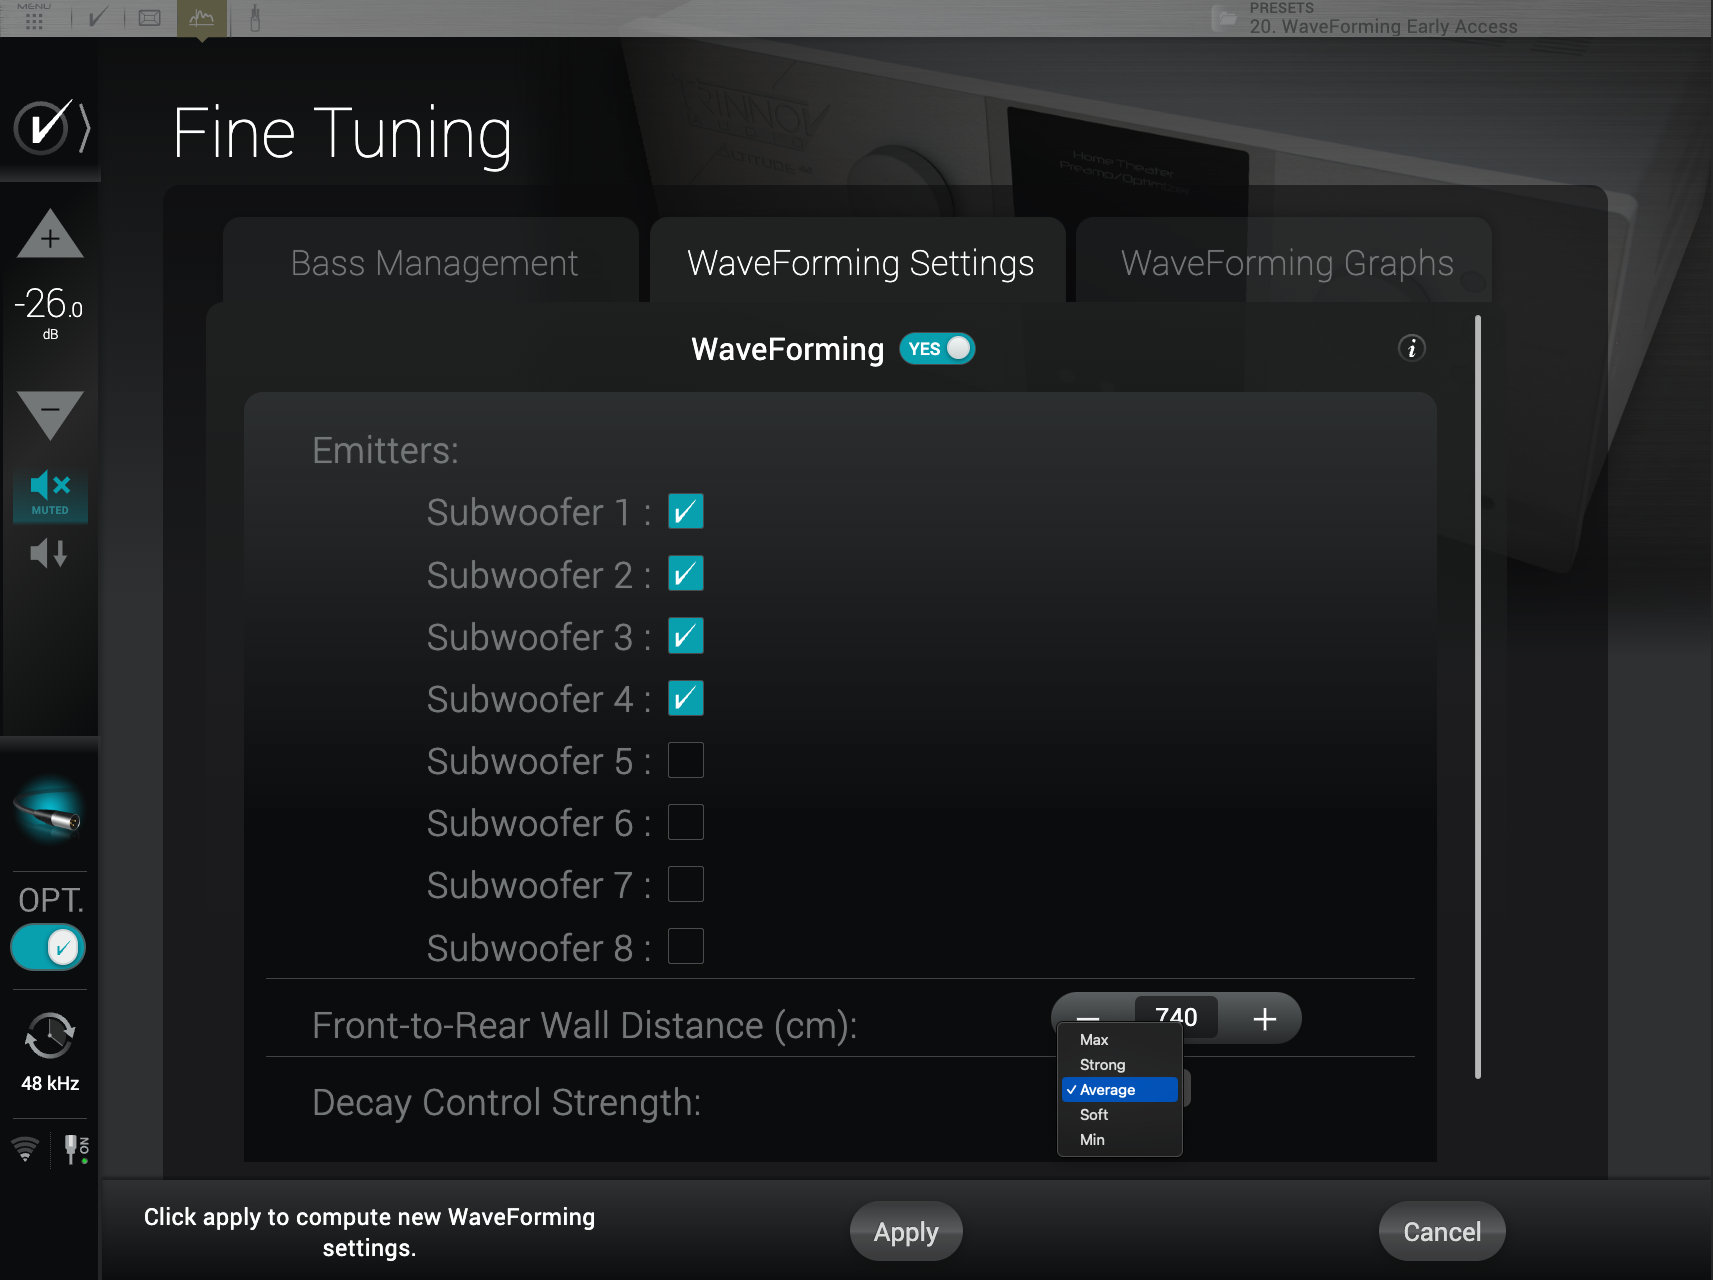
This new software adds a new WaveForming menu next to Bass Management.
Once WaveForming has been enabled, the user is invited to choose which subwoofers are emitters (as opposed to pure absorbers).

WaveForming Settings menu
The second most important and impactful parameter requires the calibrator to enter the distance between the front and rear wall (which is not necessarily the same as the distance between the front and rear arrays of subwoofers).
Based on this value, the system will automatically determine the value underlying the decay control strength setting. Depending on the amount of decay control required, the user can choose between 5 different strength from (wettest) minimmum to maximum (dryest) decay control.
WaveForming Graphs
The second additional tab includes a new set of acoustic graphs that are specific to WaveForming.
Before WaveForming, the Optimizer graphs were already an extremely powerful and flexible tool that allowed anyone to look at the acoustic data from any possible angle.
As an example, assuming a multisubwoofer system and multiple acoustic measurements taken throughout the listening area, the Optimizer graphs would typically allow you to:
- Compare the response of your different subwoofer by overlaying all subwoofer responses in a single graph, showing either the before or after optimization results, as well as the filter response.
- Look at the variation of a subwoofer response at the different seats by overlaying a single subwoofer's response for every measurement point.
This is only a fraction of what you can achieve in just a few clicks with the Optimizer graphs.

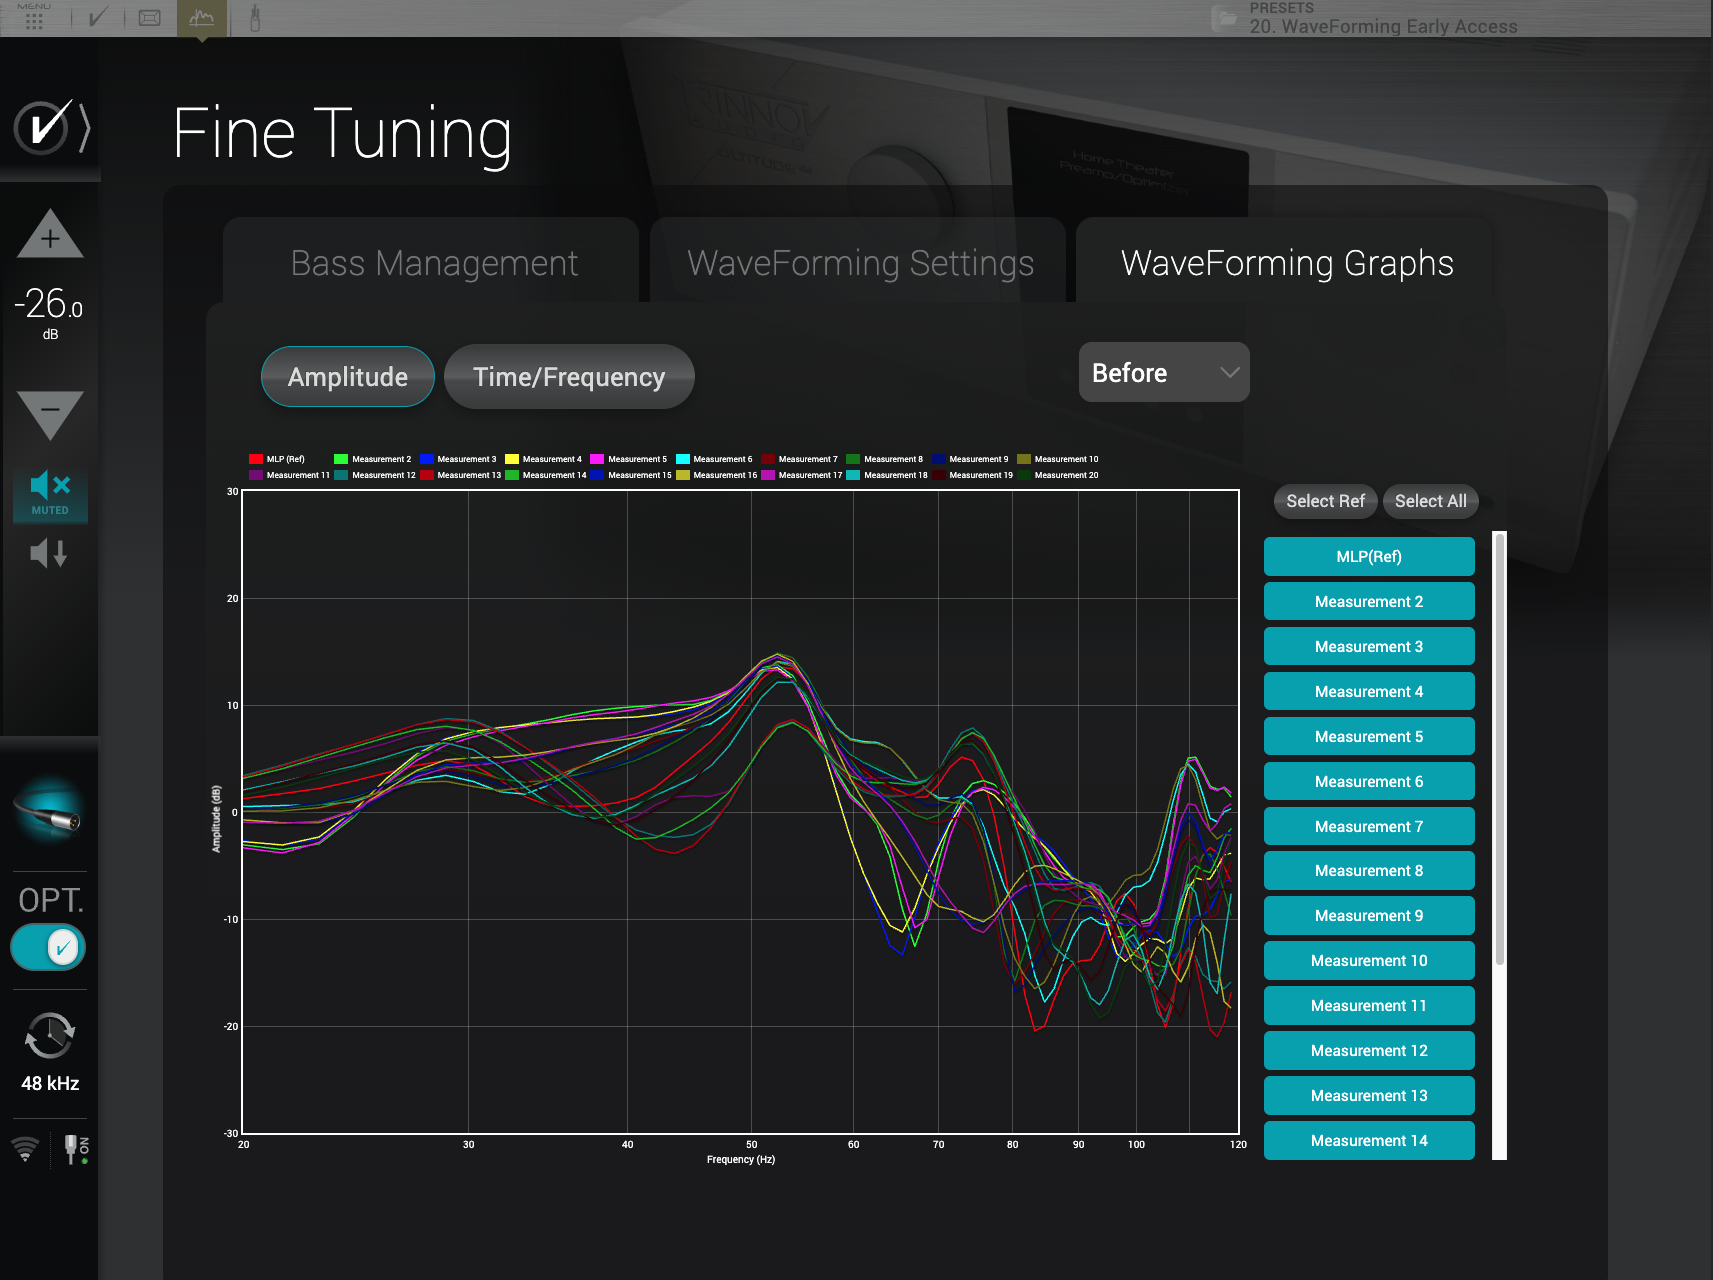
Amplitude response before WaveForming

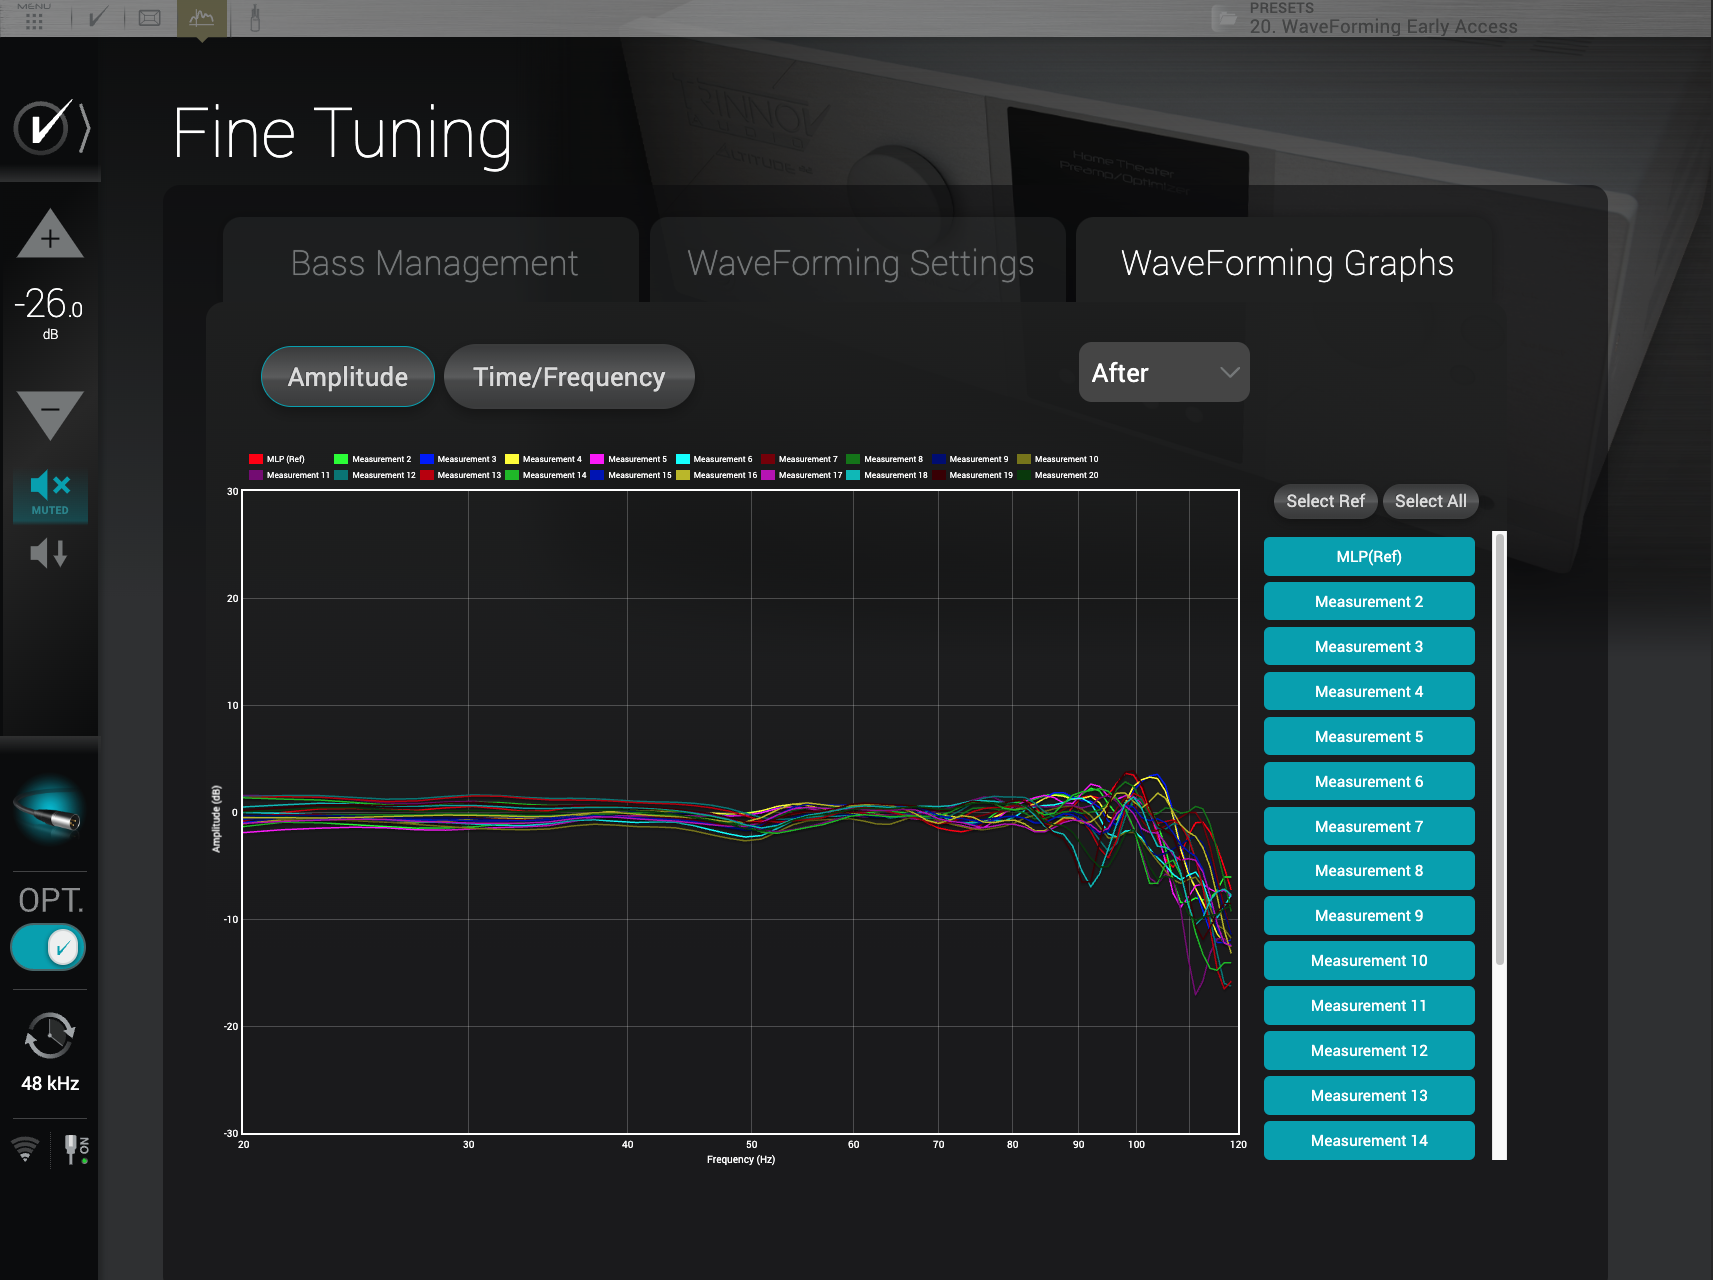
Amplitude response after WaveForming
Whilst the Optimizer graphs already offer more acoustic information than any other room correction system, Trinnov went the extra mile with WaveForming graphs.
The Optimizer offers the ability to display various acoustic responses for each subwoofer, but it does consider every subwoofer individually.
However, a more perceptual representation of the low frequency requires to display the recombined response of all subwoofers playing together, which is precisely what the WaveForming graphs do.
With the WaveForming graphs, you can visualize the before/after response in the amplitude domain of your WaveForming system across all measurement points. But you can also visualize the impact of WaveForming on the decay time in the dedicated Time/Frequency tab.
Interested in WaveForming?
If you are interested in WaveForming and would like to be part of our Early Access program, please take a look at our subwoofer placement guidelines before you start designing or modifying your system.
Please contact a Trinnov dealer to apply.
WaveForming is constantly improving, if you would like to stay informed, please subsbribe to our newsletter to receive regular updates about our continous research and innovations.

